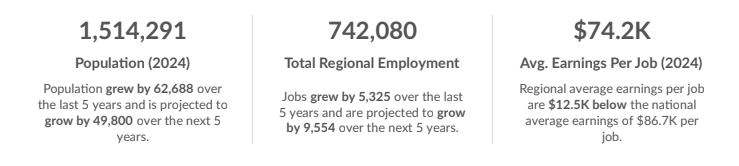
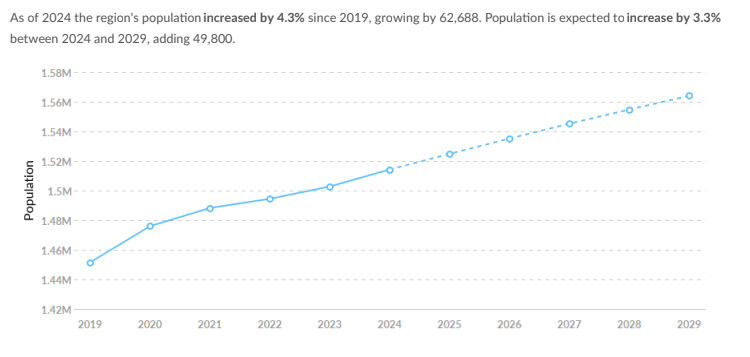
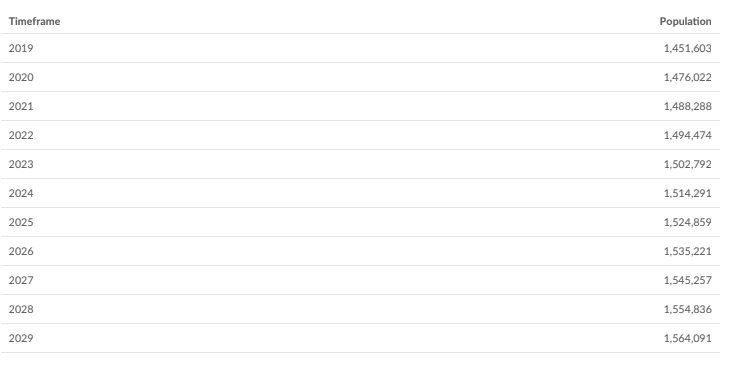
As of 2024, the region’s population has increased by 4.3% since 2019, growing by 62,857. Population is expected to increase by 3.4% between 2024 and 2029, adding 51,413.
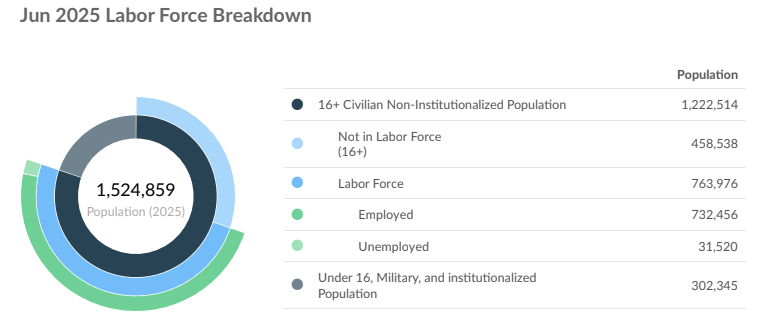
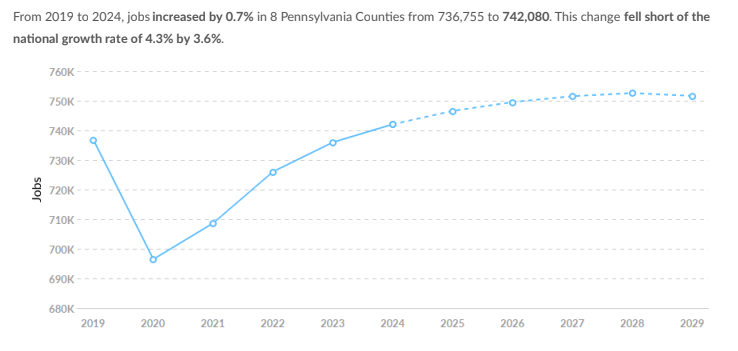
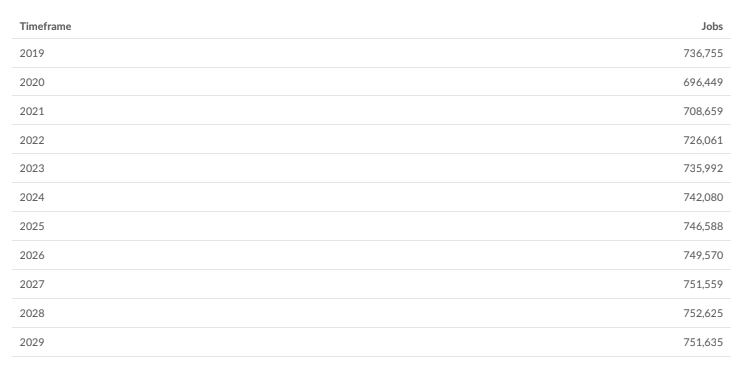
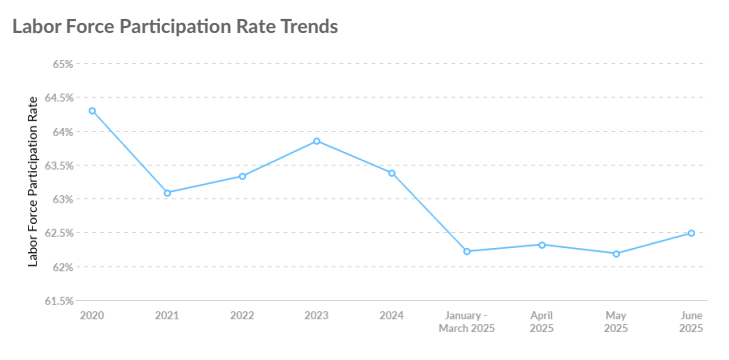
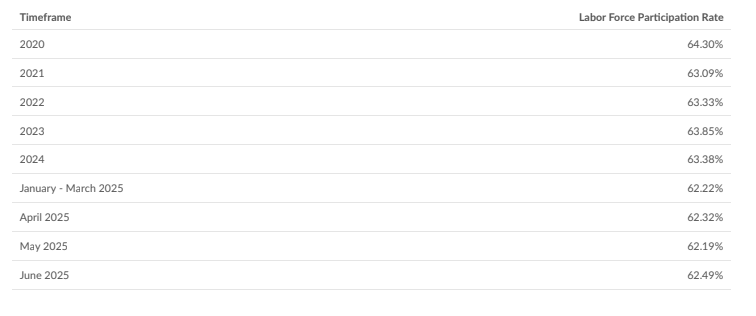
From 2019 to 2024, jobs increased by 0.3% in South Central Pennsylvania (SCPa Works) region from 736,922 to 738,772. This change fell short of the national growth rate of 3.9% by 3.6%. As the number of jobs increased, the labor force participation rate decreased from 66.4% to 63.4% between 2019 and 2024.
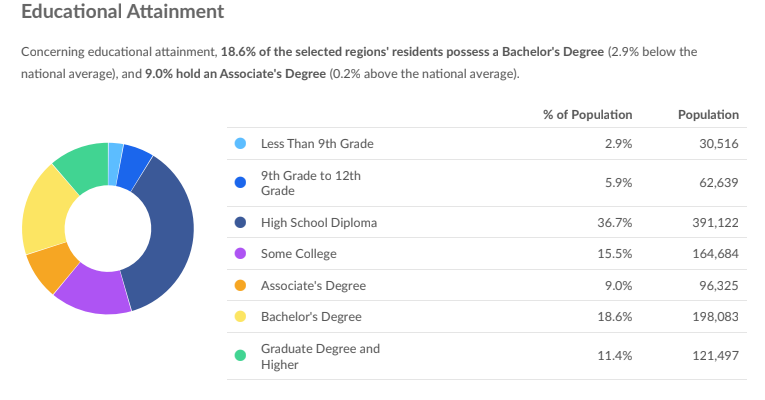
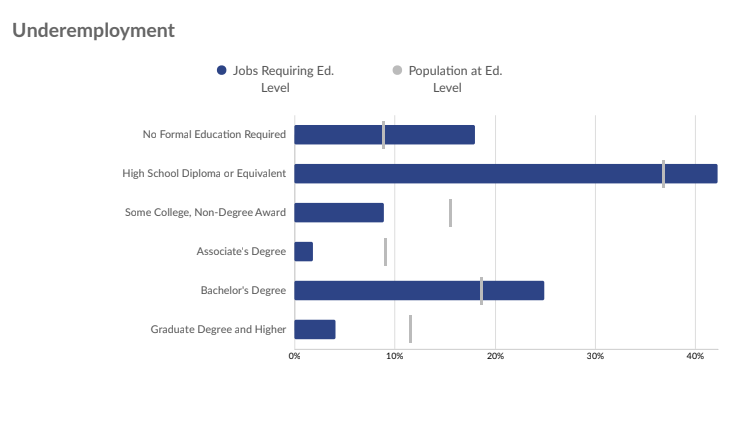
Concerning educational attainment, 18.4% of the selected regions’ residents possess a Bachelor’s Degree (3.0% below the national average), and 9.2% hold an Associate’s Degree (0.2% above the national average).
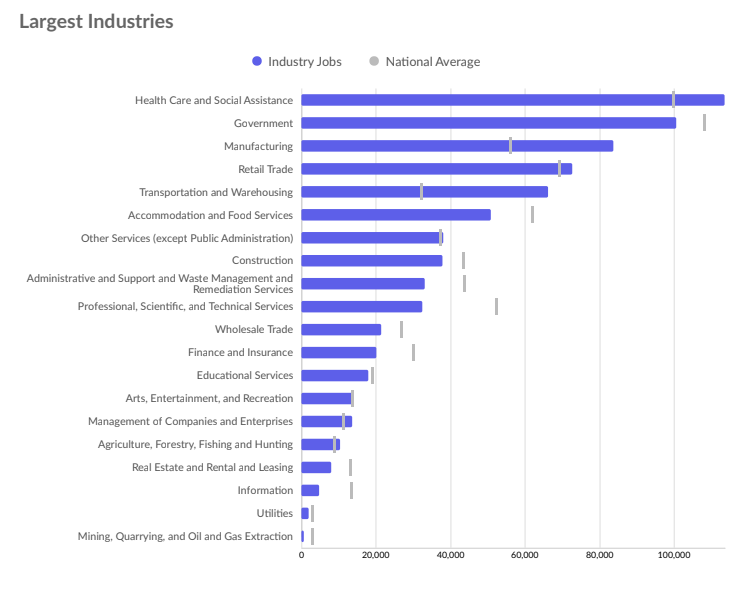
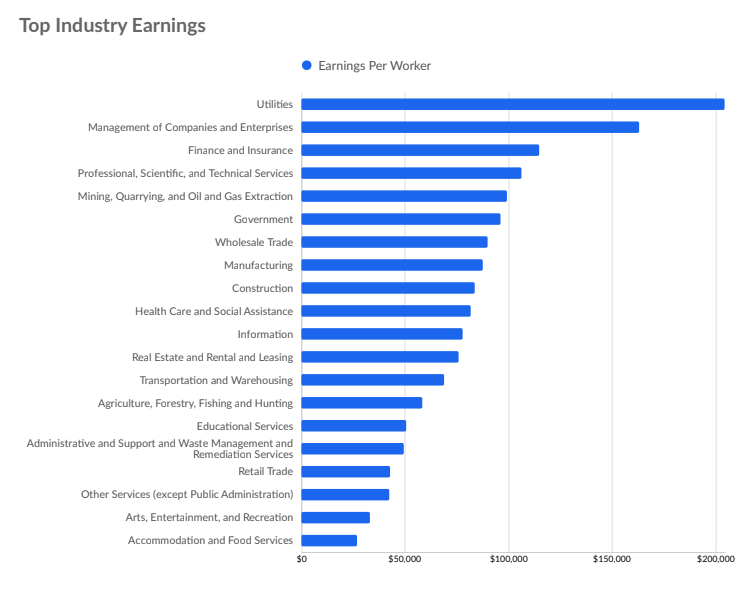
The top three industries in 2024 are Restaurants and Other Eating Places, Warehousing and Storage, and Education and Hospitals (Local Government).
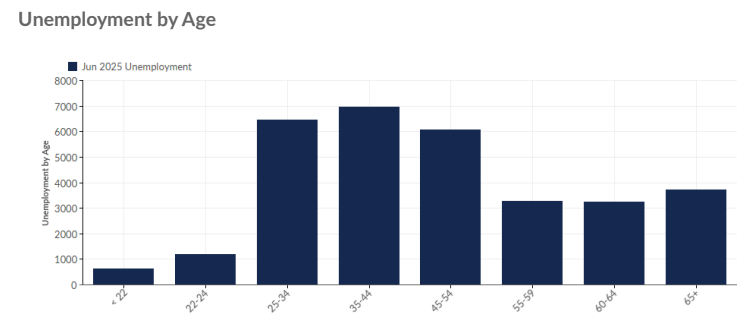
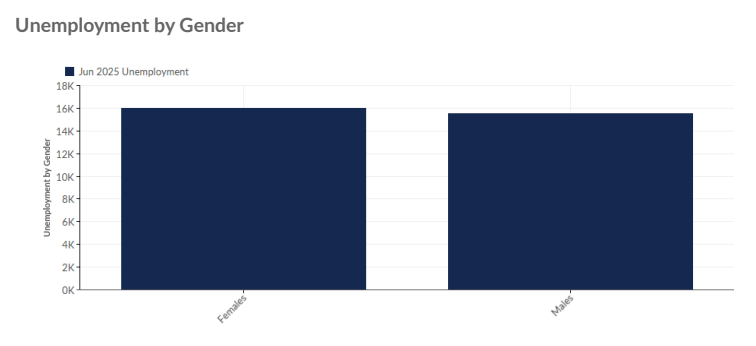
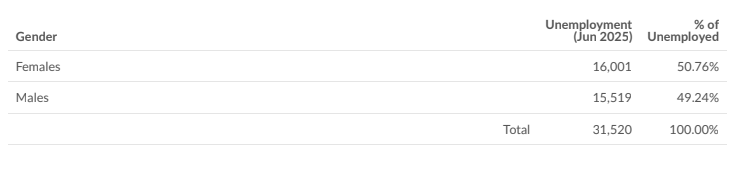
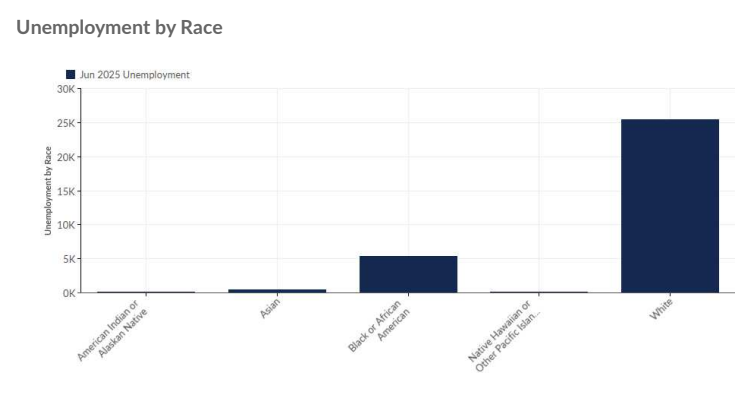
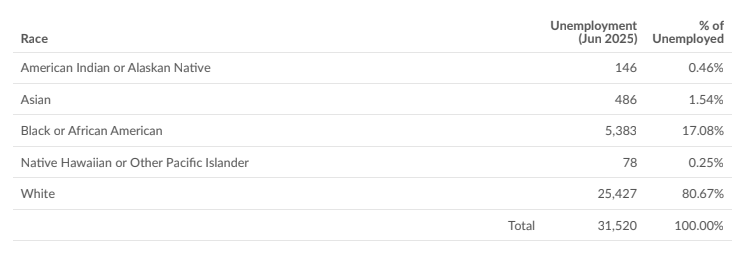
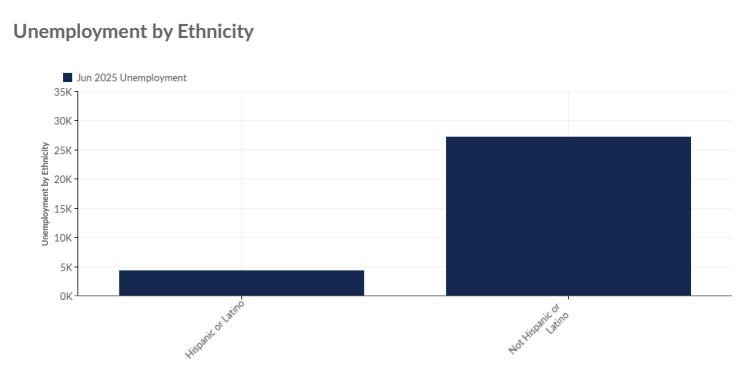
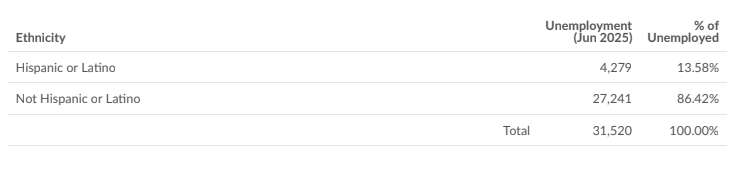
Unemployment Demographics
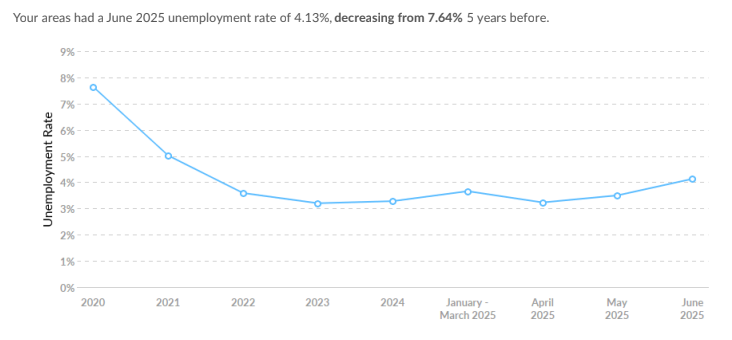
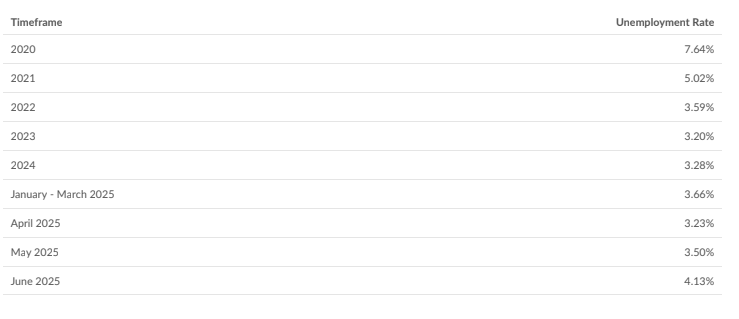
Unemployment Rate Trends
Population Trends
Job Trends
Labor Force Participation Rate Trends
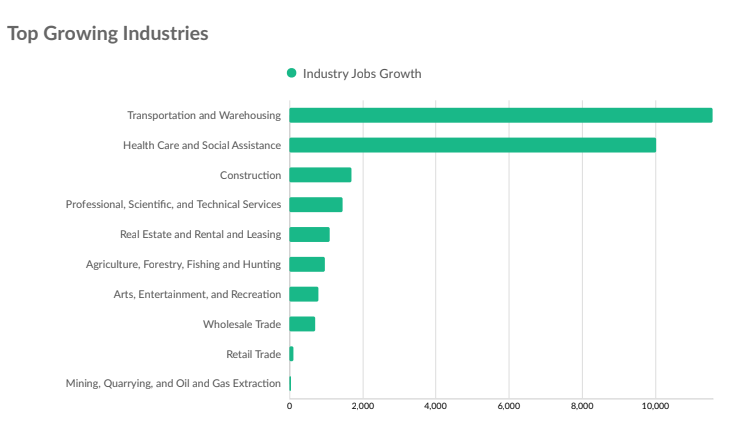
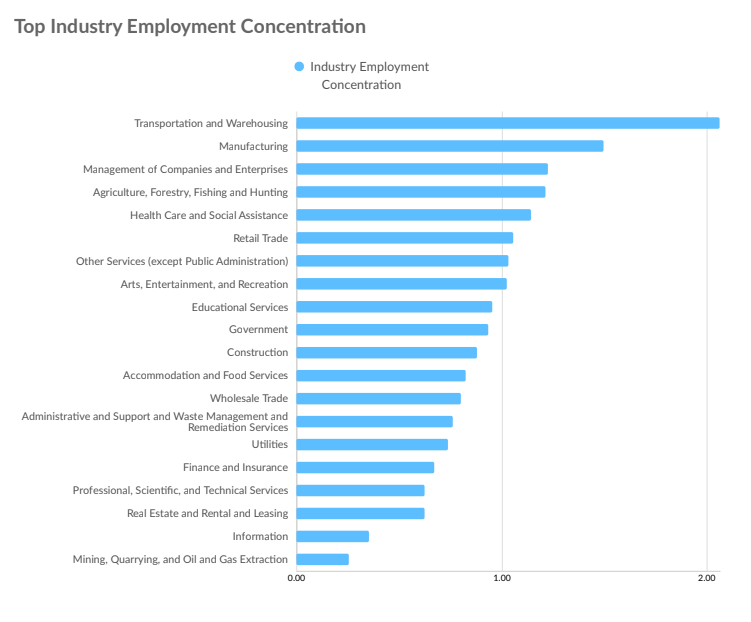
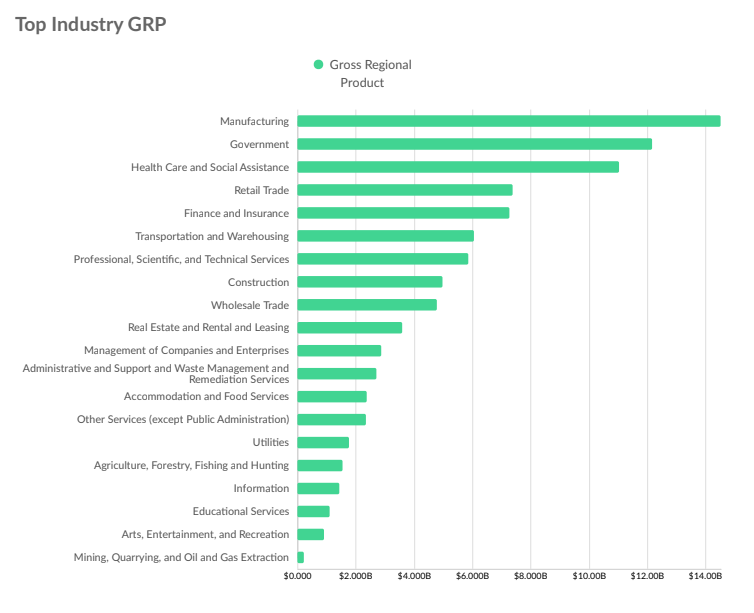
Industry
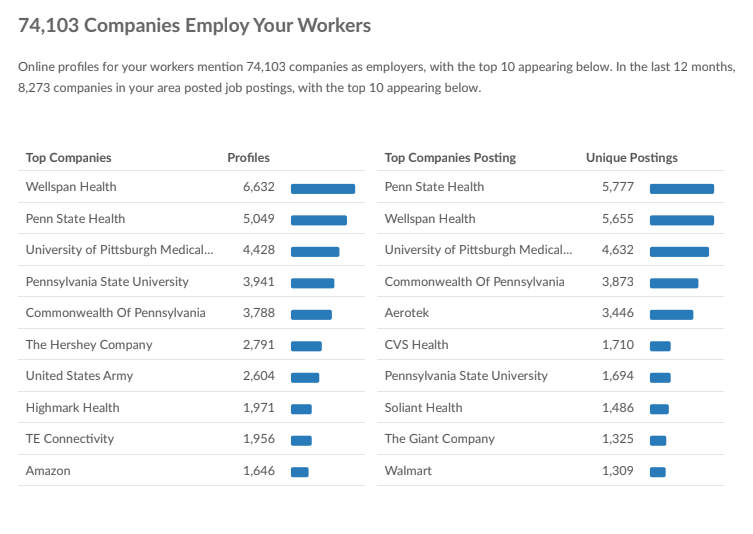
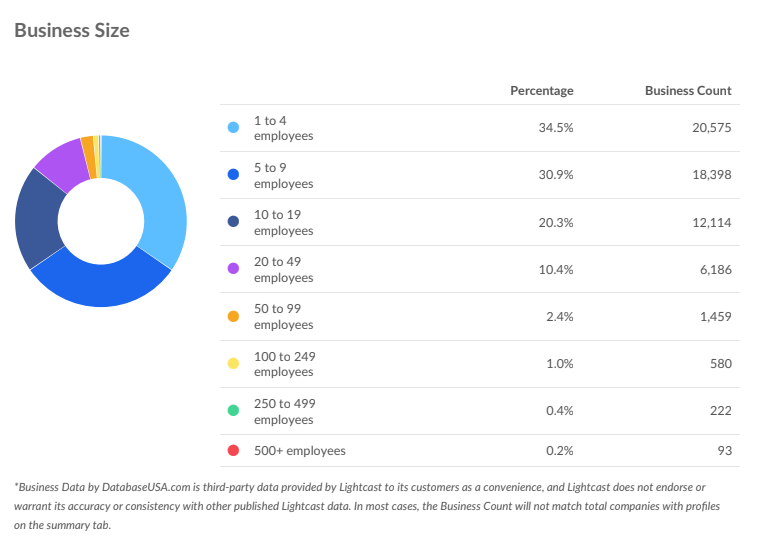
Business Characteristics
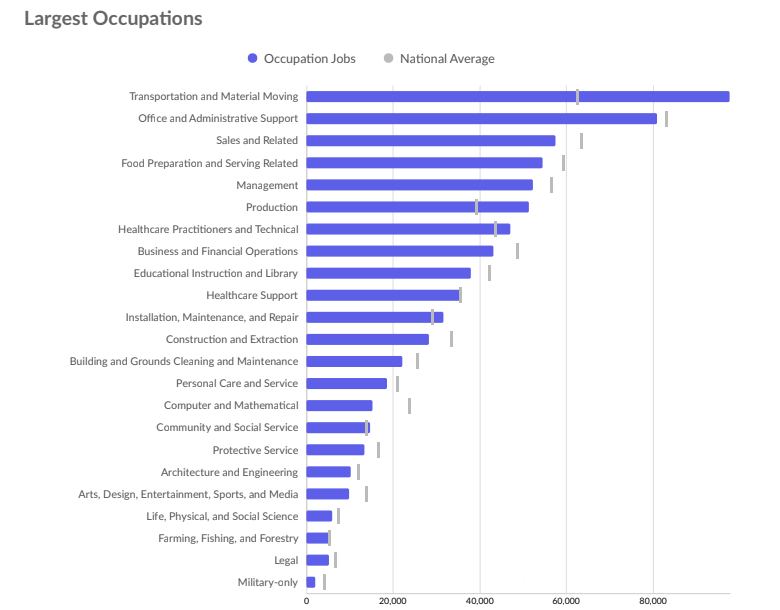
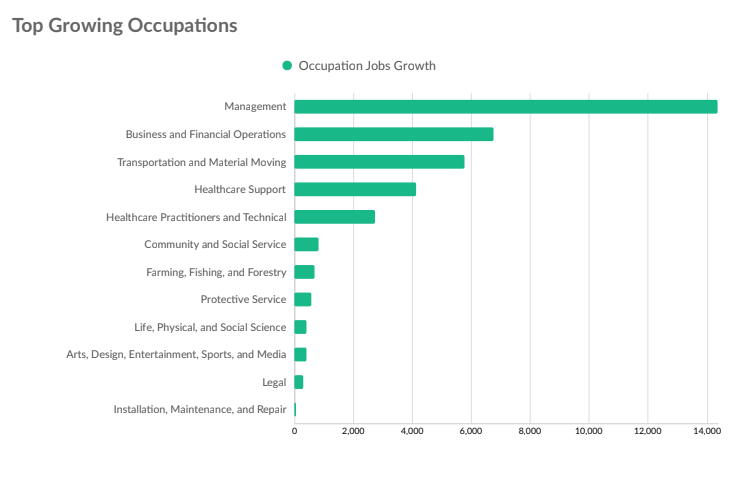
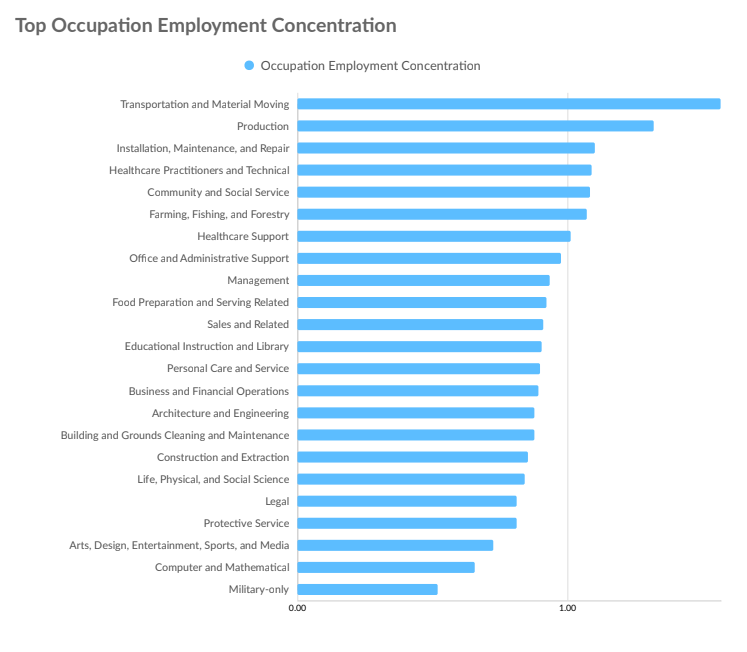
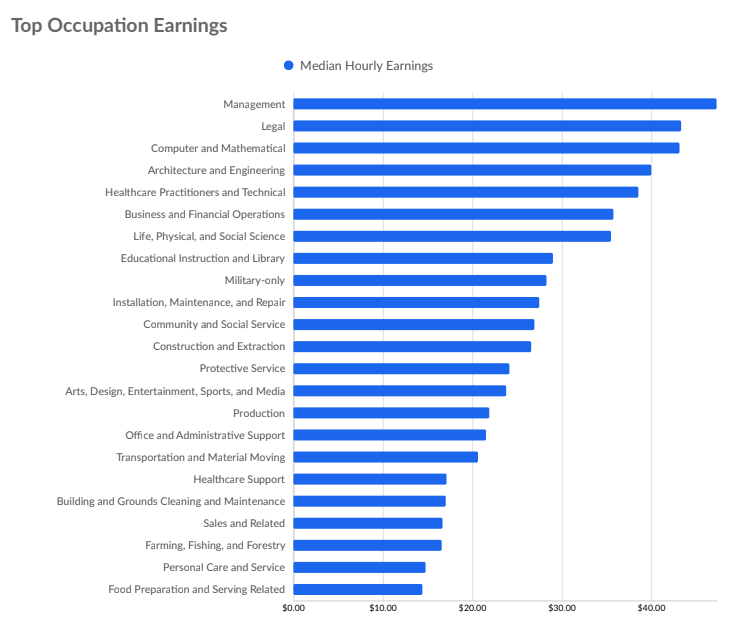
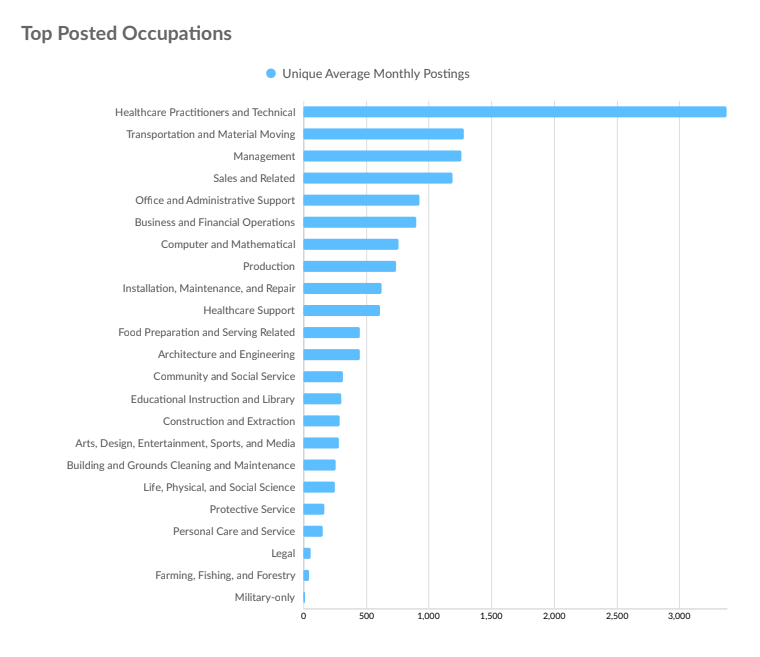
Workforce Occupations
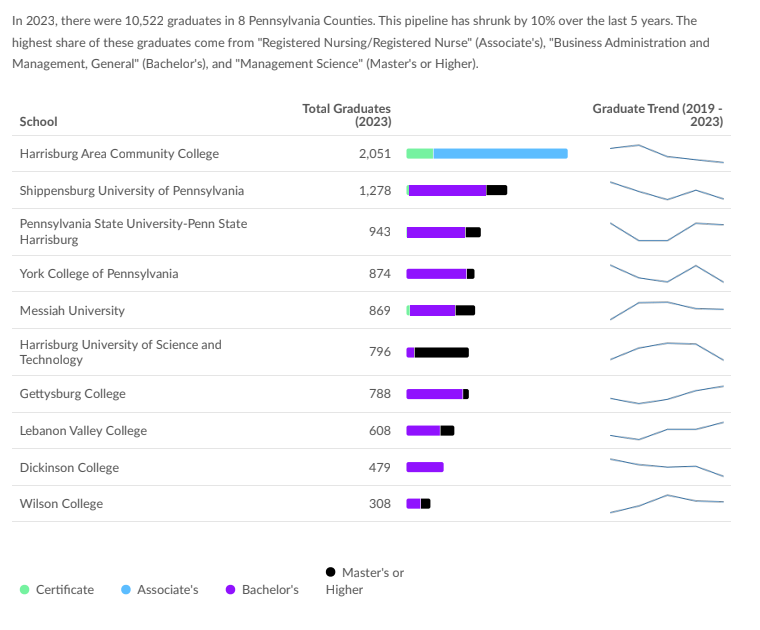
Educational Pipeline
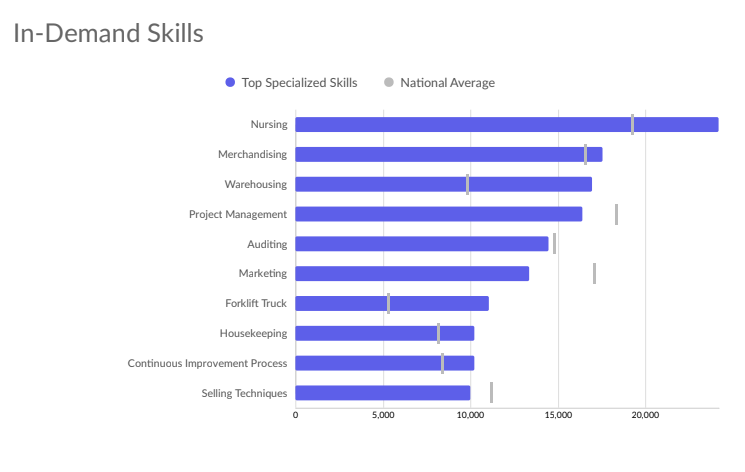
In-Demand Skills
Data contained here is provided to you by Lightcast.